- At Mweinga farm, a cow takes at least 180 units of vitamin A and not less than 160 units of vitamin B. Vitamin A and...(Solved)
At Mweinga farm, a cow takes at least 180 units of vitamin A and not less than 160 units of vitamin B. Vitamin A and B are available in two types of feeds, x and y. Type x feeds contains 45 units per kg of vitamin A and 20 units per kg of vitamin B while type Y feeds contains 30 units per kg of vitamin A and 40 units of vitamin B. Taking x and y to be the number of Kgs of feed x and y respectively taken by the cow per day.
a)Form all the inequalities that represent the above information.
b)Show the region described by the all inequalities in (a) above graphically.
c)Given that 1kg of x costs sh40 and 1kg of y costs sh50, use your graph in (b) above to determine the least cost of maintaining a cow at the Mweinga farm.
Date posted: September 19, 2019. Answers (1)
- a) Complete the table below.
b) Draw the graphs of y = 2sin (½ x – 30)0and y = ½ Cos 2x for -1800= x =...(Solved)
a) Complete the table below.
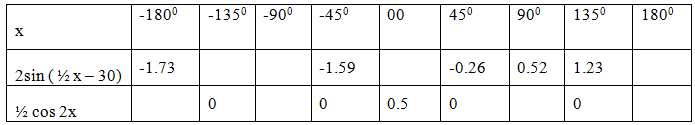
b) Draw the graphs of y = 2sin (½ x – 30)0and y = ½ Cos 2x for -1800≤ x ≤ 1800. Use a scale of 2cm for 45o on x-axis and 1cm to 0.5 units on y-axis.
c) Use your graph to solve the equations.
i) 2 sin (½ x – 30) = 0.55
ii) 4 sin (½ x – 30) – Cos 2x = 0
d) State period of the equation y = 2 sin (½ x – 30)o.
Date posted: September 19, 2019. Answers (1)
- A ball is thrown upwards from the top of a cliff h metres above sea level with acceleration of -9.8m/s2 and an initial velocity of...(Solved)
A ball is thrown upwards from the top of a cliff h metres above sea level with acceleration of -9.8m/s2 and an initial velocity of 9.8m/s
i) Write down an expression for the height h of the ball above sea level if the height of the cliff is 100m.
ii) Calculate the greatest height reached by the ball above sea level.
Date posted: September 19, 2019. Answers (1)
- i)Sketch the curve y = x2 – 2x
ii) Use your sketch to find the areas between the x-axis and y = x2 – 2x from...(Solved)
i)Sketch the curve y = x2 – 2x
ii) Use your sketch to find the areas between the x-axis and y = x2 – 2x from x = 0 to x = 3.
Date posted: September 19, 2019. Answers (1)
- The table below shows the rate of taxation in a certain year.
Income in K£ p.a Rate of taxation shs per K£
1 – 3900 2
3901 – 7800 3
7801...(Solved)
The table below shows the rate of taxation in a certain year.
Income in K£ p.a Rate of taxation shs per K£
1 – 3900 2
3901 – 7800 3
7801 - 11700 4
11701 – 15600 5
15601 – 19500 7
Above 19500 9
In that period Mrs. Kalii earns a basic salary of kshs22,000 and is entitled to a house allowance of ksh10,000 per month. If she gets a personal relief of sh.1056 per month.
a)Calculate how much income tax she paid per month.
b)Mrs. Kalii’s other deductions per month were;
-Co-operative society contributions of Ksh.2,000
-Loan repayment kshs.2260
-Provident fund deducted through check off system at 2% of his basic salary.
Calculate his net monthly pay.
Date posted: September 19, 2019. Answers (1)
- Given that xo is an angle in the first quadrant such that 8sin2x + 2Cos x – 5 = 0, find tan x. (Solved)
Given that xo is an angle in the first quadrant such that 8sin2x + 2Cos x – 5 = 0, find tan x.
Date posted: September 19, 2019. Answers (1)
- find the distance between two points A(50oN, 20oE) and (50oN, 50oE) in;
i)Kilometers
ii)Nautical miles (Take R = 6400km and p= 3.142)
(Solved)
find the distance between two points A(50oN, 20oE) and (50oN, 50oE) in;
i)Kilometers
ii)Nautical miles (Take R = 6400km and π= 3.142)
Date posted: September 19, 2019. Answers (1)
- Without using tables or a calculator, find the value of(Solved)
Without using tables or a calculator, find the value of 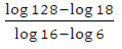
Date posted: September 19, 2019. Answers (1)
- Use the trapezium rule to estimate the area under the curve y = x2 + x – 6 over the interval 0 = x =...(Solved)
Use the trapezium rule to estimate the area under the curve y = x2 + x – 6 over the interval 0 ≤ x ≤ 8 using 4 trapezia.
Date posted: September 19, 2019. Answers (1)
- a)Expand (2 + x/4)5 upto the term in x3. b) Use your expansion to estimate the value of (1.975)5. Give your answer in 3 significant...(Solved)
a)Expand (2 + x/4)5 upto the term in x3.
b) Use your expansion to estimate the value of (1.975)5. Give your answer in 3 significant figures.
Date posted: September 19, 2019. Answers (1)
- A industrialist has 450 litres of a chemical which is 70% pure. He mixes it with a chemical of the same type but 90% pure...(Solved)
A industrialist has 450 litres of a chemical which is 70% pure. He mixes it with a chemical of the same type but 90% pure so as to obtain a mixture which is 75% pure. Find the amount of the 90% pure chemical used.
Date posted: September 19, 2019. Answers (1)
- The sum of two numbers m and n is 7. The sum of m and the reciprocal of n is 3 ¼. Find the two...(Solved)
The sum of two numbers m and n is 7. The sum of m and the reciprocal of n is 3 ¼. Find the two possible values of m and n.
Date posted: September 19, 2019. Answers (1)
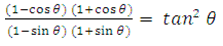
- Show that;(Solved)
Show that;
Date posted: September 19, 2019. Answers (1)
- Ruth deposited sh20,000 in a fixed deposit account for a period of 1½ years. The bank pays compound interest on quarterly basis. At the end...(Solved)
Ruth deposited sh20,000 in a fixed deposit account for a period of 1½ years. The bank pays compound interest on quarterly basis. At the end of this period her account had shs46,200. Determine the rate at which interest was paid per annum.
Date posted: September 19, 2019. Answers (1)
- The average of the first and fourth terms of a G.P is 140. Given that the first term is 64, find the common ratio. (Solved)
The average of the first and fourth terms of a G.P is 140. Given that the first term is 64, find the common ratio.
Date posted: September 19, 2019. Answers (1)
- Simplify(Solved)
Simplify 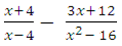
Date posted: September 19, 2019. Answers (1)
- Make A the subject of the formula given that(Solved)
Make A the subject of the formula given that 
Date posted: September 19, 2019. Answers (1)
- Given that 1.5 = x = 3.8 and 2.4 = y = 5, determine the smallest and the greatest value of x – y and...(Solved)
Given that 1.5 ≤ x ≤ 3.8 and 2.4 ≤ y ≤ 5, determine the smallest and the greatest value of x – y and hence the range of x – y.
Date posted: September 19, 2019. Answers (1)
- A ball is kicked vertically upwards from a point 0.5m above the ground at a velocity of 16m/s. Assuming that acceleration due to gravity is...(Solved)
A ball is kicked vertically upwards from a point 0.5m above the ground at a velocity of 16m/s. Assuming that acceleration due to gravity is 10m/s2
Determine
a)An expression for its velocity t seconds later
b)An expression for its height above the ground t seconds later
c)The maximum height reached by the ball
Date posted: September 19, 2019. Answers (1)
- a)Using a ruler and a pair of compass only construct triangle ABC in which angle BAC = 120o AB = 6.4cm and AC = 7.0cm (Solved)
a)Using a ruler and a pair of compass only construct triangle ABC in which angle BAC = 120o AB = 6.4cm and AC = 7.0cm
Measure
i) angle ABC
ii) BC
b) Construct the circumscribed circle of triangle ABC with O as its centre. Describe the circumscribed circle as a locus
Date posted: September 19, 2019. Answers (1)