- a)Draw a rectangle PQRS, P(1, 1) Q(4,1), R(4, 3) and S(1, 3) and its image P1Q1R1S1
under a transformation represented by the matrix.
b)P1Q1R1S1 is mapped...(Solved)
a)Draw a rectangle PQRS, P(1, 1) Q(4,1), R(4, 3) and S(1, 3) and its image P1Q1R1S1
under a transformation represented by the matrix.
b)P1Q1R1S1 is mapped onto P11Q11R11S11 by the matrix 
Draw the image P11Q11R11S11, on the same axes.
c)Determine the single matrix which maps P11Q11R11S11 onto PQRS
d)Find the coordinates of P111Q111R111S111 the image of P11Q11R11S11 after a reflection in the line y = x.
Date posted: September 23, 2019. Answers (1)
- The income taxation table for the year 2010 was as shown;
Mr. Ochieng is an employee who earns a basic salary of Ksh.30,000 per month. Other...(Solved)
The income taxation table for the year 2010 was as shown;
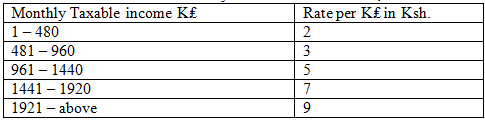
Mr. Ochieng is an employee who earns a basic salary of Ksh.30,000 per month. Other
monthly benefits are a house allowance of Ksh.6,000 and commuter allowance of Ksh.3,400.
He claims a tax relief of sh.1156 per month.
Calculate
a)i)His monthly taxable income in K₤
ii)His monthly net tax
b)Other deductions per month are:-
NHIF Kshs.320
Coop Loan Ksh.5400
WCPS ksh.300
Calculate his monthly net salary
Date posted: September 23, 2019. Answers (1)
- The figure below shows a cuboid ABCDEFGH. AB = 6cm, BC = 4cm and CG = 8cm.
Given that N is the midpoint of EH.
Calculate...(Solved)
The figure below shows a cuboid ABCDEFGH. AB = 6cm, BC = 4cm and CG = 8cm.
Given that N is the midpoint of EH.
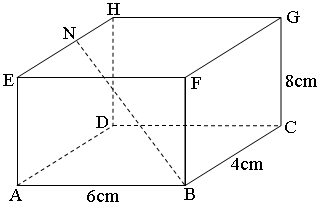
Calculate the angle between line BN and the base ABCD.
Date posted: September 23, 2019. Answers (1)
- Solve the trigonometric equation.
Cos 2x = sin x for 00 < x < 3600(Solved)
Solve the trigonometric equation.
Cos 2x = sin x for 00 < x < 3600
Date posted: September 23, 2019. Answers (1)
- Two points are A(-4, 3) and B(6, -7). A point P moves such that its locus is equidistant
from A and B. Find the equation...(Solved)
Two points are A(-4, 3) and B(6, -7). A point P moves such that its locus is equidistant
from A and B. Find the equation of the locus of P in the form ax + by = c.
Date posted: September 23, 2019. Answers (1)
- a)Expand (1 – 2x)10 up to the 4th term.
b)Hence use your expansion in (a) above to evaluate (0.98)10 correct to 4s.f(Solved)
a)Expand (1 – 2x)10 up to the 4th term.
b)Hence use your expansion in (a) above to evaluate (0.98)10 correct to 4s.f
Date posted: September 23, 2019. Answers (1)
- The cost C of operating a computer business is partly constant and partly varies as the square of labour input L. If C = 25,000...(Solved)
The cost C of operating a computer business is partly constant and partly varies as the square of labour input L. If C = 25,000 when L = 20 and C = 45,000 when L = 30. Find C when L = 8.
Date posted: September 23, 2019. Answers (1)
- Two lines, x + 2y = -1 and 2x + 3y = 3 intersect at a point P. Find the equation of the circle, Centre...(Solved)
Two lines, x + 2y = -1 and 2x + 3y = 3 intersect at a point P. Find the equation of the circle, Centre P, radius 4 units giving your answer in the form x2 + y2 + ax + by = c, where a, b and c are constants.
Date posted: September 23, 2019. Answers (1)
- The gradient function of a curve is given as 3x2 – 4x + 1. If the curve passes through the Point (1, -2). Find the...(Solved)
The gradient function of a curve is given as 3x2 – 4x + 1. If the curve passes through the Point (1, -2). Find the equation of the curve.
Date posted: September 23, 2019. Answers (1)
- Make S the subject of the formula (Solved)
Make S the subject of the formula

Date posted: September 23, 2019. Answers (1)
- Using the mid-ordinate rule with four strips, estimate the area under the curve from x = 0 to x = 4.(Solved)
Using the mid-ordinate rule with four strips, estimate the area under the curve  from x = 0 to x = 4.
Date posted: September 23, 2019. Answers (1)
- Some Form Four students went for a contest and scored the following marks, marked out of 10 marks: 6, 5, 2, 7, 3, 9, 8...(Solved)
Some Form Four students went for a contest and scored the following marks, marked out of 10 marks: 6, 5, 2, 7, 3, 9, 8 and 8. Calculate the standard deviation.
Date posted: September 23, 2019. Answers (1)
- A student measured the length and width of a rectangular field and recorded as
9.5m by 4.0m. Calculate the percentage error in the area of...(Solved)
A student measured the length and width of a rectangular field and recorded as
9.5m by 4.0m. Calculate the percentage error in the area of the field.
Date posted: September 23, 2019. Answers (1)
- Using a ruler and a pair of compasses only, construct triangle PQR such that PQ=5cm,QR=4cm and angle PQR=1200. Measure PR. On the diagram, construct a...(Solved)
Using a ruler and a pair of compasses only, construct triangle PQR such that PQ=5cm,QR=4cm and angle PQR=1200. Measure PR. On the diagram, construct a circle centre O which passes through the vertices of the triangle PQR. Measure the radius of the circle. Measure the shortest distance from the centre of the circle to the lines PQ and QR.
Date posted: September 23, 2019. Answers (1)
- A student throws a regular tetrahedron and a die he recorded the outcome when they settled.
a) Write down the probability sample space for all...(Solved)
A student throws a regular tetrahedron and a die he recorded the outcome when they settled.
a) Write down the probability sample space for all possible outcomes.
b) Find the probability that the numbers appearing on the die and the tetrahedron have a product of 4 or 12.
c) Find the probability that the sum of the numbers on top is 5 or more than 5.
d) Find the probability that both numbers are odd.
Date posted: September 23, 2019. Answers (1)
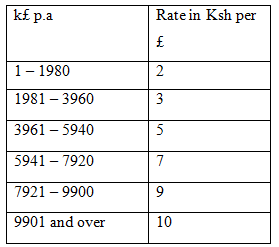
- Mr. Wangila is a salaried civil servant. He earns a basic monthly salary of sh. 20,640, a house allowance of sh. 6,800p.m and medical allowance...(Solved)
Mr. Wangila is a salaried civil servant. He earns a basic monthly salary of sh. 20,640, a house allowance of sh. 6,800p.m and medical allowance of sh. 2800p.m. He claims a family relief of sh. 400p.m. He pays sh. 300 per month and 2% of his salary towards water bills and NHIF respectively.
Calculate his net monthly salary in Ksh using the tax rates shown in the table below.
Date posted: September 23, 2019. Answers (1)
- Solve for x in the equation(Solved)
Solve for x in the equation

Date posted: September 23, 2019. Answers (1)
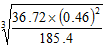
- Use logarithms tables to evaluate(Solved)
Use logarithms tables to evaluate
Date posted: September 23, 2019. Answers (1)
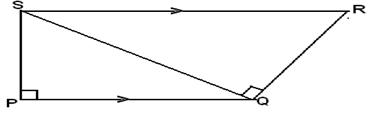
- In the figure below, PQ//SR,SPO=SOR = 900, RS =7cm and QR = 4cm. Calculate the length of PQ correct to three significant figures.(Solved)
In the figure below, PQ//SR,SPO=SOR = 900, RS =7cm and QR = 4cm. Calculate the length of PQ correct to three significant figures.
Date posted: September 23, 2019. Answers (1)
- Solve for x given that:(Solved)
Solve for x given that: 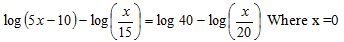
Date posted: September 23, 2019. Answers (1)