- The average of the first and fourth terms of a GP is 185. Given that the first term is 27, find the common ratio.(Solved)
The average of the first and fourth terms of a GP is 185. Given that the first term is 27, find the common ratio.
Date posted: September 24, 2019. Answers (1)
- Solve for x in log(2x + 4) - log(x-1) = 3log 2.(Solved)
Solve for x in log(2x + 4) - log(x-1) = 3log 2.
Date posted: September 24, 2019. Answers (1)
- Make h the subject of the formula (Solved)
Make h the subject of the formula 
Date posted: September 24, 2019. Answers (1)
- Evaluate(Solved)
Evaluate 
Date posted: September 24, 2019. Answers (1)
- Solve the following linear inequalities and list the integral values of x.(Solved)
Solve the following linear inequalities and list the integral values of x.

Date posted: September 24, 2019. Answers (1)
- The equation of a circle is given by 4x2 + 4y2 +12x – 16y -11 = 0. Determine the radius and the co-ordinates of...(Solved)
The equation of a circle is given by 4x2 + 4y2 +12x – 16y -11 = 0. Determine the radius and the co-ordinates of the centre of the circle.
Date posted: September 24, 2019. Answers (1)
- The cost of maize flour and millet flour is Kshs 44 and Kshs 56 respectively. Calculate the ratio in which they were mixed if a...(Solved)
The cost of maize flour and millet flour is Kshs 44 and Kshs 56 respectively. Calculate the ratio in which they were mixed if a profit of 20% was made by selling the mixture at Kshs. 54.
Date posted: September 24, 2019. Answers (1)
- Solve for theta given that 2sin theta=tan theta for 00 less than or = theta less than or = 3600. (Solved)
Solve for theta given that 2sin theta=tan theta for 00 less than or = theta less than or = 3600.
Date posted: September 24, 2019. Answers (1)
- Given the expression 9.7 ÷ 3.7, find to four significant figures the percentage error in its quotient. (Solved)
Given the expression 9.7 ÷ 3.7, find to four significant figures the percentage error in its quotient.
Date posted: September 24, 2019. Answers (1)
- Evaluate using logarithms. (Solved)
Evaluate using logarithms.

Date posted: September 24, 2019. Answers (1)
- The data below shows length of leaves in a plant in mm. Complete the table.
Using D, calculate;
(i) The mean
(ii) The variance
(iii) The standard deviation(Solved)
The data below shows length of leaves in a plant in mm. Complete the table.


Using D, calculate;
(i) The mean
(ii) The variance
(iii) The standard deviation
Date posted: September 24, 2019. Answers (1)
- The relation between two variables P and V is believed to be of the form where A and B are constants.
(a)...(Solved)
The relation between two variables P and V is believed to be of the form  where A and B are constants.

(a) Draw a suitable line graph and use it to determine the value of A and B
(b) Estimate the value of P when the value of V is 5.
Date posted: September 24, 2019. Answers (1)
- The manager of Hilton hotel has enough funds to buy at most 100 crates of soft drinks of type A and type B. He wishes...(Solved)
The manager of Hilton hotel has enough funds to buy at most 100 crates of soft drinks of type A and type B. He wishes to buy more than twice as many crates of type A as type B. He wants to buy a maximum of 80 crates of type A and at least 10 crates of type B. Letting x represent the number of crates of type A and y the number of crates of type B;
(a) Write down all the inequalities which represent the above information.
(b) Represent the inequalities in (a) above on the graph provided.
The profit from the sale of a crate of type A is kshs. 60, while that of type B is kshs. 40. Find the number of crates he should buy to maximize his profit.
(c) Find the profit.
Date posted: September 24, 2019. Answers (1)
- a)Using trapezium rule estimate the area enclosed by the curve y = -x2, the x-axis and the lines x = 5 and x = 2,...(Solved)
a)Using trapezium rule estimate the area enclosed by the curve y = -x2, the x-axis and the lines x = 5 and x = 2, using 7 ordinates.
(b) Find the exact area.
(c) Find the percentage error in using trapezium rule.
(d) Estimate the area using mid-ordinate rule with six strips
Date posted: September 24, 2019. Answers (1)
- It has been established that the probability of Pangani and Moi Girls teams scoring 0,1,2 and 3 goals against each other are shown in the...(Solved)
It has been established that the probability of Pangani and Moi Girls teams scoring 0,1,2 and 3 goals against each other are shown in the table below


(a)Use a probability space to show all the possible outcomes.
(b)Calculate the probability of
(i)Pangani winning
(ii)A draw
(iii)Moi Girls scoring at least three goals.
Date posted: September 24, 2019. Answers (1)
- Mrs. Muta earns K£ 12000 p.a. and is housed by the employer at a nominal rent of shs. 1200 p.m. She is entitled to a...(Solved)
Mrs. Muta earns K£ 12000 p.a. and is housed by the employer at a nominal rent of shs. 1200 p.m. She is entitled to a personal relief of K£ 1320 p.a. and a premium relief of 10% on her insuarance premium of K£ 800 p.a. or a maximum of shs. 200 p.m. The housing benefit is 15% of the salary.

Calculate;
(a)Net tax p.a.
(b)Other deductions include;
W.C.P.S shs. 600 p.m.
NHIF shs. 500 p.m.
Calculate her net pay per month.
Date posted: September 24, 2019. Answers (1)
- A plank AD is lying against a log of circular cross-section of radius 1.4 cm as shown.
Given that AB is 6 cm, find the height...(Solved)
A plank AD is lying against a log of circular cross-section of radius 1.4 cm as shown.

Given that AB is 6 cm, find the height of C above the ground.
Date posted: September 24, 2019. Answers (1)
- If find the possible values of x which satisfy the matrix product.(Solved)
If 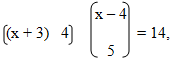 find the possible values of x which satisfy the matrix product.
Date posted: September 24, 2019. Answers (1)
- Two brands of coffee Arabica and Robusta cost shs. 4700 and shs. 4200 per kilogram respectively, are mixed to produce a blend that costs shs....(Solved)
Two brands of coffee Arabica and Robusta cost shs. 4700 and shs. 4200 per kilogram respectively, are mixed to produce a blend that costs shs. 4600 per kilogram. Find the ratio of the mixture.
Date posted: September 24, 2019. Answers (1)
- Under a transformation represented by a matrix a triangle of area 10 cm2 is mapped on to a triangle whose area is 110 cm2....(Solved)
Under a transformation represented by a matrix  a triangle of area 10 cm2 is mapped on to a triangle whose area is 110 cm2. Find x.
Date posted: September 24, 2019. Answers (1)