- The table below shows tax rates in the year 2012.
(a)Mrs. Mwangi pays Ksh.5400 as PAYE. She is entitled to a house allowance of Ksh.9000p.m...(Solved)
The table below shows tax rates in the year 2012.
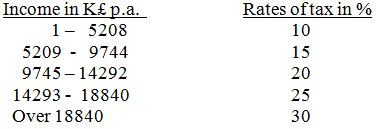
(a)Mrs. Mwangi pays Ksh.5400 as PAYE. She is entitled to a house allowance of Ksh.9000p.m and claims a monthly tax relief of Ksh.1093. Calculate;
(i)Her gross tax per annum.
(ii)Her monthly basic salary in Ksh.
(b)She also has monthly contributions as follows:
(i)Cooperative society contribution of Ksh.2000.
(ii)Loan repayment of Ksh.2500.
Calculate her net monthly salary.
Date posted: September 25, 2019. Answers (1)
- The figure below shows a circle centre O, AB is a diameter. Chords ED and BH are equal NHJ, FET, STD are tangents to...(Solved)
The figure below shows a circle centre O, AB is a diameter. Chords ED and BH are equal NHJ, FET, STD are tangents to the circle angle ECD = 20º and AHE = 30º. The figure is not drawn to scale.
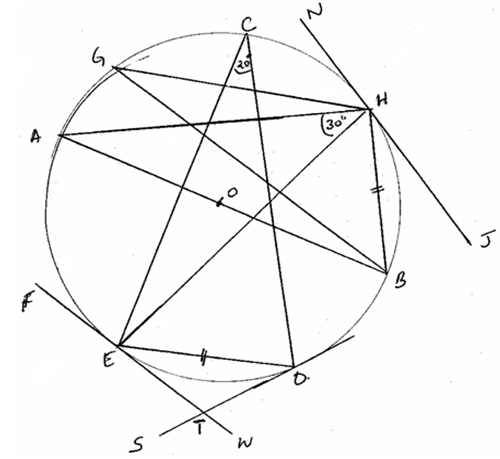
Determine angles.
(i)EHB.
(ii)ETS
(iii)HGB
(iv)EHJ
(v)AOE.
Date posted: September 25, 2019. Answers (1)
- (a)A die and a coin (both fair) are thrown on a horizontal floor.
(i)List all the possible outcomes.
(ii)Find the probability of getting even number on the...(Solved)
(a)A die and a coin (both fair) are thrown on a horizontal floor.
(i)List all the possible outcomes.
(ii)Find the probability of getting even number on the die and a tail on
the coin or an odd number on the die and a head on the coin.
(iii)Find the probability of getting a number greater than or equal to 3 on
the die and a head on the coin.
(b)The probability that a student gets grade A in Mathematics is 9/10. If she gets grade A in Mathematics then the probability that she gets grade A in Physics is 4/5. If she does not get grade A in Mathematics then the probability that she gets grade A in Physics is 3/8. Calculate the probability that she gets grade A in Physics only.
Date posted: September 25, 2019. Answers (1)
- In the figure below ABCD is a trapezium with DC parallel to AB. DC = 10cm, BC = 8cm, DB = 16cm and AB...(Solved)
In the figure below ABCD is a trapezium with DC parallel to AB. DC = 10cm, BC = 8cm, DB = 16cm and AB = 20cm.

(a)Calculate the sine of angle BDC.
(b)Hence calculate the area of ABD.
Date posted: September 25, 2019. Answers (1)
- Evaluate:(Solved)
Evaluate: 
Date posted: September 25, 2019. Answers (1)
- Simplify:(Solved)
Simplify: 
Date posted: September 25, 2019. Answers (1)
- The figure is a cuboid. The dimensions of the cuboid are 10cm by 5cm by 3cm.
Find the angle between.
(a)lines CG and DE.
(b)lines FG and...(Solved)
The figure is a cuboid. The dimensions of the cuboid are 10cm by 5cm by 3cm.

Find the angle between.
(a)lines CG and DE.
(b)lines FG and DB.
Date posted: September 25, 2019. Answers (1)
- Find the distance between the centre A of a circle whose equation is
2x2 + 2y2 +6x +10y +7 = 0(Solved)
Find the distance between the centre A of a circle whose equation is
2x2 + 2y2 +6x +10y +7 = 0
Date posted: September 25, 2019. Answers (1)
- x and Y are complementary angles and Tanx=3v3 . Find the value of hence rationalize the surd.(Solved)
x and Y are complementary angles and Tanx=3√3 . Find the value of  hence rationalize the surd.
Date posted: September 25, 2019. Answers (1)
- A point R divides vector PQ in the ratio 5: -2. Find the coordinates of R given that P (3, -6) and Q (-9,...(Solved)
A point R divides vector PQ in the ratio 5: -2. Find the coordinates of R given that P (3, -6) and Q (-9, 2).
Date posted: September 25, 2019. Answers (1)
- A shopkeeper mixes sugar costing Sh.40 per kg with another type which costs Sh.60 per kg. Find the ratio in which the two types...(Solved)
A shopkeeper mixes sugar costing Sh.40 per kg with another type which costs Sh.60 per kg. Find the ratio in which the two types should be mixed so that if a kilogram of the mixture is sold at Sh.55, a profit of 10% is realised.
Date posted: September 25, 2019. Answers (1)
- Find the inverse of the matrix hence use the matrix method to solve the simultaneous equations.
2x -2y =6
3x + y = 5(Solved)
Find the inverse of the matrix  hence use the matrix method to solve the simultaneous equations.
2x -2y =6
3x + y = 5
Date posted: September 25, 2019. Answers (1)
- Solve the simultaneous equation.
log3(2x+y) = 2
log2(3x+4y) = 4(Solved)
Solve the simultaneous equation.
log3(2x+y) = 2
log2(3x+4y) = 4
Date posted: September 25, 2019. Answers (1)
- (a)Without using a calculator, expand (10 - 2x)5.
(b)Use your expansion in (a) above to find the value of (9.8)5.(Solved)
(a)Without using a calculator, expand (10 - 2x)5.
(b)Use your expansion in (a) above to find the value of (9.8)5.
Date posted: September 25, 2019. Answers (1)
- y varies inversely as the square of x. The difference between the value of y when x = 6 and when x = 10...(Solved)
y varies inversely as the square of x. The difference between the value of y when x = 6 and when x = 10 is 16. Find the law connecting x and y.
Date posted: September 25, 2019. Answers (1)
- Solve the equation.(Solved)
Solve the equation.
sin(2x-300)=1/2 for 00 ≤ x ≤ 3600
Date posted: September 25, 2019. Answers (1)
- Make M the subject in(Solved)
Make M the subject in 
Date posted: September 25, 2019. Answers (1)
- A rectangular plot measures 31.4m by 28.3m. What is the percentage error in getting it’s area.(Solved)
A rectangular plot measures 31.4m by 28.3m. What is the percentage error in getting it’s area.
Date posted: September 25, 2019. Answers (1)
- Evaluate using logarithms.(Solved)
Evaluate using logarithms.

Date posted: September 25, 2019. Answers (1)
- In a mathematics test, the probability of 3 students, Kamau, Otieno and Mwala passing are ?, ¾ and ? respectively
(a)Draw a tree diagram to represent...(Solved)
In a mathematics test, the probability of 3 students, Kamau, Otieno and Mwala passing are ⅔, ¾ and ⅚ respectively
(a)Draw a tree diagram to represent this information
(b)Use the tree diagram to find the probability that:
(i)All the three students will fail
(ii)At least two students will pass.
(iii)Only one student will pass
Date posted: September 24, 2019. Answers (1)