- Give four reasons why discounts are granted.(Solved)
Give four reasons why discounts are granted.
Date posted: September 25, 2019. Answers (1)
- Identify the macro-environmental factor affecting business operations as described by the following statements.
(a)Laws and policies that regulate business activities
(b)Affects buyer’s ability to buy commodities offered...(Solved)
Identify the macro-environmental factor affecting business operations as described by the following statements.
(a)Laws and policies that regulate business activities
(b)Affects buyer’s ability to buy commodities offered by a business
(c)Firms selling similar products trying to out do each other in their efforts to maximize profits
(d)Dictates how people live and what products they consume
Date posted: September 25, 2019. Answers (1)
- The following trial balance was extracted from the books of Rafiki traders as at 31st December 2018.(Solved)
The following trial balance was extracted from the books of Rafiki traders as at 31st December 2018.

Required:
(i) Prepare Rafiki traders trading profit and loss account.
(ii) A balance sheet as at 31st December 2018.
Date posted: September 25, 2019. Answers (1)
- By aid of a diagram, explain how price of a commodity is determined by the forces of demand and supply.(Solved)
By aid of a diagram, explain how price of a commodity is determined by the forces of demand and supply.
Date posted: September 25, 2019. Answers (1)
- On 1st May 2018, Sosiot traders had Sh.25,000 Cash in hand and Bank overdraft of sh 15,000. During the month the following transactions took place.(Solved)
On 1st May 2018, Sosiot traders had Sh.25,000 Cash in hand and Bank overdraft of sh 15,000. During the month the following transactions took place.
2018
May 3: Kipkurui ,a debtor settled his account of sh 12000 by cheque of sh 10,000
May 5: Paid rent by cash sh. 5000
May 6: Deposited sh. 2000 into the business bank account from the cash till.
May 8: Received sh 6000 Cash from Kamau, a debtor
May 10: Wanjiku a debtor settled her account of 15,000 by cheque, having been
allowed 20% discount.
May 15: Purchased Furniture worth sh 3,000 paying by cheque
May 18: Deposited sh 7,000 into the bank from private sources.
May 23: Received the following amounts in cash from debtors having deducted
cash discount of 5%. Kertich sh 7600, Brian sh 4750
May 25: Banked all the available Cash except sh 1000
Required:
Prepare a dully balanced three column cash book.
Date posted: September 25, 2019. Answers (1)
- Kenya is endowed with some economic resources yet it has failed to exploit them.
Outline five reasons that account for this.(Solved)
Kenya is endowed with some economic resources yet it has failed to exploit them.
Outline five reasons that account for this.
Date posted: September 25, 2019. Answers (1)
- The table below shows the Gross Domestic Product (GDP) of a country X in the year 2014 to 2018(Solved)
The table below shows the Gross Domestic Product (GDP) of a country X in the year 2014 to 2018

a)Explain five factors that may have caused the above trend.
b) Explain five causes of demand pull inflation
Date posted: September 25, 2019. Answers (1)
- Explain five reasons for the popularity of using social media in product promotion.(Solved)
Explain five reasons for the popularity of using social media in product promotion.
Date posted: September 25, 2019. Answers (1)
- Explain five ways in which the demographic environment may positively influence business activities(Solved)
Explain five ways in which the demographic environment may positively influence business activities
Date posted: September 25, 2019. Answers (1)
- Outline four reasons why subsistence production is discouraged in many countries.(Solved)
Outline four reasons why subsistence production is discouraged in many countries.
Date posted: September 25, 2019. Answers (1)
- John and Peter bought a Nissan matatu worth sh. 3,000,000. John paid sh. 2,000,000 and Peter sh. 1,000,000. They insured the matatu for a comprehensive...(Solved)
John and Peter bought a Nissan matatu worth sh. 3,000,000. John paid sh. 2,000,000 and Peter sh. 1,000,000. They insured the matatu for a comprehensive cover for shs 2,500,000. Later the matatu was involved in an accident to a loss of sh 1,500,000. How much were they compensated and give reasons in support of your answer?
Date posted: September 25, 2019. Answers (1)
- Record the following transactions in the relevant journals.(Solved)
Record the following transactions in the relevant journals.
2019
Feb 2: Bought goods on Credit worth shs6500 from Eldolink suppliers
Feb 8: Sold goods worth shs5000 on credit to Jamal.
Feb 12: Sold stock valued at shs8500 on credit to Musyoka
Feb 16: Bought goods worth shs3000 on credit from Jetlink traders
Date posted: September 25, 2019. Answers (1)
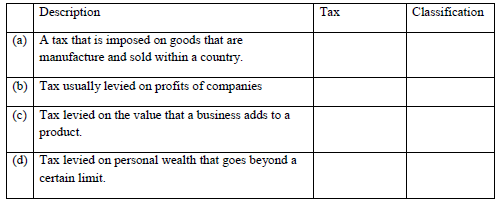
- 20.The following statements relates to a description of a certain type of tax. Identify the tax and classify it as either direct or indirect tax.(Solved)
20.The following statements relates to a description of a certain type of tax. Identify the tax and classify it as either direct or indirect tax.
Date posted: September 25, 2019. Answers (1)
- State four levels of inflation.(Solved)
State four levels of inflation.
Date posted: September 25, 2019. Answers (1)
- The following balance sheet belongs to Rivatex Traders.(Solved)
The following balance sheet belongs to Rivatex Traders.
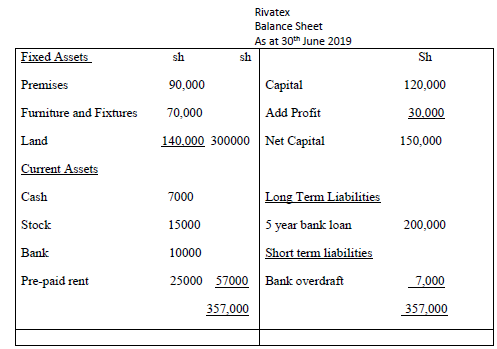
Required: Calculate
i) Working Capital
ii) Borrowed Capital
iii) Capital Employed
iv) Capital invested
Date posted: September 25, 2019. Answers (1)
- On 1st January 2012, Mlachake traders had cash in hand Ksh. 10,000 and cash at bank shs 15000. The following transactions took place during the...(Solved)
On 1st January 2012, Mlachake traders had cash in hand Ksh. 10,000 and cash at bank shs 15000. The following transactions took place during the month:
Jan 2: Bought goods in cash sh. 1500
Jan 4: Paid salaries by cash sh 7500.
Jan 5: Received cheques from the following debtors after allowing 2% discount in each case. Masy sh 980, kiplimo sh .1960.
Jan 8: Settled the following accounts by cheque in each case deducting 5 % discount; Juma sh 3000, Kasani shs 1200.
Jan 12: Bought machinery worth sh 7000, paid sh 5000 by cheque and the balance to be paid later
Jan 20: Took sh 1000 for personal use from the business cash till.
Jan 25: Cash sales sh 2000
Jan 26: Received cash shs.3000 from Kioko, a Debtor.
Jan 28: Brought in Sh 2000 cash from his personal savings.
Jan 29: Banked all cash except sh. 1000
Required: Prepare a fuly balanced three column cashbook.
Date posted: September 25, 2019. Answers (1)
- Explain four ways in which central bank of Kenya may reduce the supply of money in the country.(Solved)
Explain four ways in which central bank of Kenya may reduce the supply of money in the country.
Date posted: September 25, 2019. Answers (1)
- Highlight four characteristics of a public warehouse.(Solved)
Highlight four characteristics of a public warehouse.
Date posted: September 25, 2019. Answers (1)
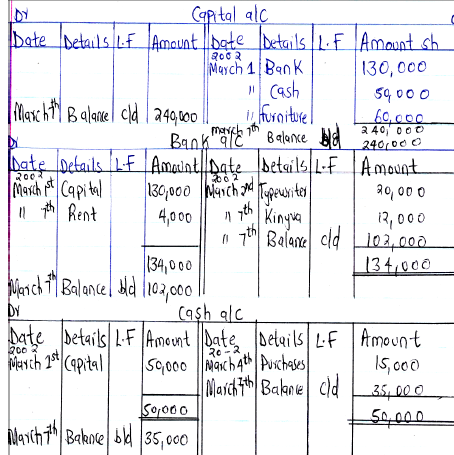
- Balance the following ledger accounts and extract a trial balance as at 30th June 2015(Solved)
Balance the following ledger accounts and extract a trial balance as at 30th June 2015
Date posted: September 25, 2019. Answers (1)
- The following trial balance relates to Kitui Millers Ltd as at 31st December 2011.
Stock as at 31/12/2011 was valued at shs. 35,000
Required:
i)Prepare a trading, profit...(Solved)
The following trial balance relates to Kitui Millers Ltd as at 31st December 2011.
Kitui Millers Ltd
Trial Balance
As 31st December 2011
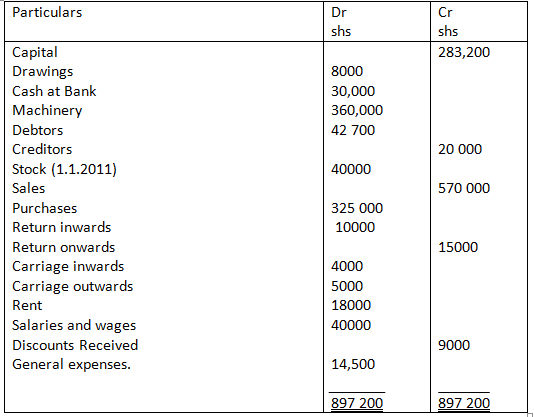
Stock as at 31/12/2011 was valued at shs. 35,000
Required:
i)Prepare a trading, profit and loss account for the year ended 31st December, 2011.
ii)Draw a balance sheet as at 31st December, 2011.
Date posted: September 25, 2019. Answers (1)