- The figure below shows a turn table, centre O with a mass of 30g at a distance of 6cm from the centre.(Solved)
The figure below shows a turn table, centre O with a mass of 30g at a distance of 6cm from the centre.

i) Determine the normal reaction between the 30g mass and the table. (2 marks)
ii) The 30g mass just slides off the table when the turn table rotates at a frequency of 1 revolution per second. Determine:
I. The angular velocity.
II. The coefficient of friction between the 30g mass and the table.
iii) Oil is poured on the table and the table is made to rotate at the same frequency of 1 revolution per second. On the figure,mark a point P along line OB where the 30g mass will just slide off.
Date posted: September 30, 2019. Answers (1)
- Define the terms ‘frequency’ as used in uniform circular motion.(Solved)
Define the terms ‘frequency’ as used in uniform circular motion.
Date posted: September 30, 2019. Answers (1)
- A gas is heated in a sealed container so that its volume cannot change. The graph below shows variation of pressure against temperature of the...(Solved)
A gas is heated in a sealed container so that its volume cannot change. The graph below shows variation of pressure against temperature of the gas.

Use the graph to determine
i) The pressure of the gas at 0oC.
ii) The temperature at which the gas should exert zero pressure.
iii) Give a reason why part (ii) above is not practically obtainable.
Date posted: September 30, 2019. Answers (1)
- Figure 7(a) and 7(b) show the readings of a micrometer screw gauge before and after a drop of oil are placed at the jaws.(Solved)
Figure 7(a) and 7(b) show the readings of a micrometer screw gauge before and after a drop of oil are placed at the jaws.

When the drop was made to fall on a shallow tray having water whose surface was sprinkled with lycopodium powder, it spread on the surface to form a patch of area Acm2. Given that the size of one molecule of oil is 3 x 10⁻⁶cm.
a) Determine:
I. The diameter of the one drop of oil
II.The area of the patch A
b) State one assumption made in this experiment.
Date posted: September 30, 2019. Answers (1)
- A hot air balloon made from a very light material displaces 360kg of air and contain 300m3 of air of density 0.25kgm-3. Determine the maximum...(Solved)
A hot air balloon made from a very light material displaces 360kg of air and contain 300m3 of air of density 0.25kgm-3. Determine the maximum load the balloon can lift.
Date posted: September 30, 2019. Answers (1)
- The figure below shows a set up used by a form one student to measure the density of a solid that floats on water.(Solved)
The figure below shows a set up used by a form one student to measure the density of a solid that floats on water.

Determine the density of the solid.
Date posted: September 30, 2019. Answers (1)
- Some potassium permanganate crystals are introduced at the bottom of water in two cans. One can has hot water while the other can has very...(Solved)
Some potassium permanganate crystals are introduced at the bottom of water in two cans. One can has hot water while the other can has very cold water.State and explain the container in which the crystals will diffuse faster.
Date posted: September 30, 2019. Answers (1)
- The figure below shows a screw jack whose pitch is 5mm. If the handle has a length of 40cm and the jack is 80% efficient....(Solved)
The figure below shows a screw jack whose pitch is 5mm. If the handle has a length of 40cm and the jack is 80% efficient. Determine the effort needed to raise a car of mass 750kg.

Date posted: September 30, 2019. Answers (1)
- Sketch a graph of displacement against time for a body moving with uniform deceleration.(Solved)
Sketch a graph of displacement against time for a body moving with uniform deceleration.
Date posted: September 30, 2019. Answers (1)
- A car got a breakdown along a road inclined at an angle of 30o to the horizontal. The driver used a stone to stop the...(Solved)
A car got a breakdown along a road inclined at an angle of 30o to the horizontal. The driver used a stone to stop the car as he looked for a mechanic. However, a boy removed the stone and the car still moved down the road without the driver. State what provided the unbalanced force that made the car to accelerate downwards?
Date posted: September 30, 2019. Answers (1)
- Explain how the propellers on top of a helicopter help in lifting the helicopter above the ground.(Solved)
Explain how the propellers on top of a helicopter help in lifting the helicopter above the ground.
Date posted: September 30, 2019. Answers (1)
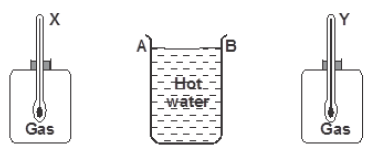
- The figure below shows a cylindrical container having hot water at 95oC. End A is shiny while end B is dull black. At equal distances...(Solved)
The figure below shows a cylindrical container having hot water at 95oC. End A is shiny while end B is dull black. At equal distances from the container is placed two identical gas jars fitted with thermometers X and Y. Compare the readings of the two thermometers after two minutes.
Date posted: September 30, 2019. Answers (1)
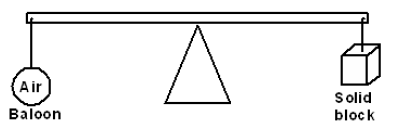
- The figure below shows an air balloon and a wooden block at equilibrium on a hot day.Explain how the equilibrium would be affected when the...(Solved)
The figure below shows an air balloon and a wooden block at equilibrium on a hot day.Explain how the equilibrium would be affected when the weather suddenly becomes cold.
Date posted: September 30, 2019. Answers (1)
- Figures 2a and 2b below shows a spring when carrying different masses.(Solved)
Figures 2a and 2b below shows a spring when carrying different masses.

i) the elastic constant of the spring.
ii) the length of the unloaded spring.
Date posted: September 30, 2019. Answers (1)
- The figure below shows a top view of two steel needles floating on water surface at a distance x metres apart.(Solved)
The figure below shows a top view of two steel needles floating on water surface at a distance x metres apart.
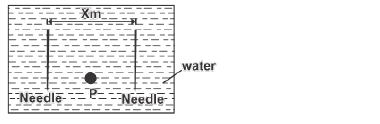
Very hot water is now poured at point P between the two needles. Explain any change in the distance x.
Date posted: September 30, 2019. Answers (1)
- The figure below shows a battery of e.m.f 12V and internal resistance of 2 ohms connected to resistors and an ammeter.(Solved)
The figure below shows a battery of e.m.f 12V and internal resistance of 2 ohms connected to resistors and an ammeter.
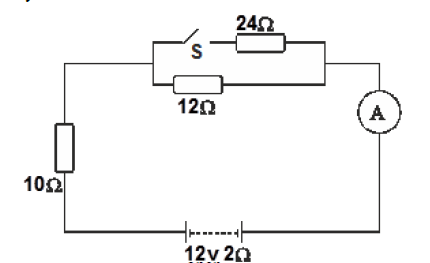
i) Determine the ammeter reading when the switch S, is open.
ii) Find the ammeter reading when the switch is closed.
Date posted: September 30, 2019. Answers (1)
- In an X-ray tube, the accelerating voltage is 100KV.(Solved)
In an X-ray tube, the accelerating voltage is 100KV.
i) Calculate the kinetic energy of the electrons arriving at the target (take e = 1.6 x 10⁻¹⁹C)
ii) If 0.5% of the kinetic energy is converted to X-rays, determine the minimum wavelength of the emitted X-rays (take h = 6.63 x 10⁻³⁴Js and C = 3.0 x 10⁸m/s)
Date posted: September 30, 2019. Answers (1)
- You are provided with the following apparatus used for studying charging of a capacitor. An uncharged capacitor, voltmeter, milliameter, 6V battery, connecting wires, a switch...(Solved)
You are provided with the following apparatus used for studying charging of a capacitor. An uncharged capacitor, voltmeter, milliameter, 6V battery, connecting wires, a switch and a load resistor R.
i) Draw a circuit diagram that can be used to charge the capacitor.
ii) Use the circuit diagram drawn above to explain how the capacitor gets charged.
iii) State the purpose of resistor R.
Date posted: September 30, 2019. Answers (1)
- The distance of separation between the plates of a certain capacitor is reduced. State how this affects the capacitance of a capacitor.(Solved)
The distance of separation between the plates of a certain capacitor is reduced. State how this affects the capacitance of a capacitor.
Date posted: September 30, 2019. Answers (1)
- A house has three rooms each with two 240V, 60W bulbs. If the bulbs are switched on from 7.00p.m to 10.00pm daily.(Solved)
A house has three rooms each with two 240V, 60W bulbs. If the bulbs are switched on from 7.00p.m to 10.00pm daily.
i) Calculate the power consumed per day in kilowatt-hours.
ii) Find the cost per week for lighting these rooms at sh.6.30 per kilowatt hour.
Date posted: September 30, 2019. Answers (1)