- A small coin lies at the bottom of a water pond at a depth of 1.2m. How far from the water surface does the observer...(Solved)
A small coin lies at the bottom of a water pond at a depth of 1.2m. How far from the water surface does the observer see it,given the speed of light in water is 2.3 x 10⁸m/s and velocity of light in air is 3.0 x 10⁸m/s.
Date posted: September 30, 2019. Answers (1)
- The figure below shows two spherical materials, one an insulation conductor and the other a conductor. Negative charges are introduced at point A in each...(Solved)
The figure below shows two spherical materials, one an insulation conductor and the other a conductor. Negative charges are introduced at point A in each case.

On the same figure indicate the final position of the charges. Explain your answer.
Date posted: September 30, 2019. Answers (1)
- The figure below shows a plastic bottle having a weighted cork floating on water inside the bottle.When the sides of the bottle are squeezed the...(Solved)
The figure below shows a plastic bottle having a weighted cork floating on water inside the bottle.When the sides of the bottle are squeezed the cork sinks.

Explain the observation.
Date posted: September 30, 2019. Answers (1)
- 50g of ice at -5oC is dropped in a well lagged copper calorimeter of mass 30g having 150g of water at 80oC. A final steady...(Solved)
50g of ice at -5oC is dropped in a well lagged copper calorimeter of mass 30g having 150g of water at 80oC. A final steady temperature of 35oC is attained. Determine specific heat capacity of ice.(Take specific heat capacity of water = 4200J/kg/k, specific latent heat of fusion of ice = 340,00J/kg and specific heat capacity of copper = 390J/kg/k)
Date posted: September 30, 2019. Answers (1)
- The figure below shows two cars A and B moving in opposite direction along a straight road. The diagram shows their respective positions at equal...(Solved)
The figure below shows two cars A and B moving in opposite direction along a straight road. The diagram shows their respective positions at equal time intervals before the crush until the cars collided at point M. The diagram is drawn to scale of 1:10

i) Explain which driver had anticipated the collision.
ii) If the time between all the intervals was 0.5 seconds.
I. Determine the velocities Vp, VQ and VR
II. Car A had a mass of 8000kg while B had a mass of 1200kg. The cars coellesced and moved together a distance of 8m before coming to rest.
Determine:
I. The velocity after collision.
II.The common acceleration
Date posted: September 30, 2019. Answers (1)
- The figure below shows a turn table, centre O with a mass of 30g at a distance of 6cm from the centre.(Solved)
The figure below shows a turn table, centre O with a mass of 30g at a distance of 6cm from the centre.

i) Determine the normal reaction between the 30g mass and the table. (2 marks)
ii) The 30g mass just slides off the table when the turn table rotates at a frequency of 1 revolution per second. Determine:
I. The angular velocity.
II. The coefficient of friction between the 30g mass and the table.
iii) Oil is poured on the table and the table is made to rotate at the same frequency of 1 revolution per second. On the figure,mark a point P along line OB where the 30g mass will just slide off.
Date posted: September 30, 2019. Answers (1)
- Define the terms ‘frequency’ as used in uniform circular motion.(Solved)
Define the terms ‘frequency’ as used in uniform circular motion.
Date posted: September 30, 2019. Answers (1)
- A gas is heated in a sealed container so that its volume cannot change. The graph below shows variation of pressure against temperature of the...(Solved)
A gas is heated in a sealed container so that its volume cannot change. The graph below shows variation of pressure against temperature of the gas.

Use the graph to determine
i) The pressure of the gas at 0oC.
ii) The temperature at which the gas should exert zero pressure.
iii) Give a reason why part (ii) above is not practically obtainable.
Date posted: September 30, 2019. Answers (1)
- Figure 7(a) and 7(b) show the readings of a micrometer screw gauge before and after a drop of oil are placed at the jaws.(Solved)
Figure 7(a) and 7(b) show the readings of a micrometer screw gauge before and after a drop of oil are placed at the jaws.

When the drop was made to fall on a shallow tray having water whose surface was sprinkled with lycopodium powder, it spread on the surface to form a patch of area Acm2. Given that the size of one molecule of oil is 3 x 10⁻⁶cm.
a) Determine:
I. The diameter of the one drop of oil
II.The area of the patch A
b) State one assumption made in this experiment.
Date posted: September 30, 2019. Answers (1)
- A hot air balloon made from a very light material displaces 360kg of air and contain 300m3 of air of density 0.25kgm-3. Determine the maximum...(Solved)
A hot air balloon made from a very light material displaces 360kg of air and contain 300m3 of air of density 0.25kgm-3. Determine the maximum load the balloon can lift.
Date posted: September 30, 2019. Answers (1)
- The figure below shows a set up used by a form one student to measure the density of a solid that floats on water.(Solved)
The figure below shows a set up used by a form one student to measure the density of a solid that floats on water.

Determine the density of the solid.
Date posted: September 30, 2019. Answers (1)
- Some potassium permanganate crystals are introduced at the bottom of water in two cans. One can has hot water while the other can has very...(Solved)
Some potassium permanganate crystals are introduced at the bottom of water in two cans. One can has hot water while the other can has very cold water.State and explain the container in which the crystals will diffuse faster.
Date posted: September 30, 2019. Answers (1)
- The figure below shows a screw jack whose pitch is 5mm. If the handle has a length of 40cm and the jack is 80% efficient....(Solved)
The figure below shows a screw jack whose pitch is 5mm. If the handle has a length of 40cm and the jack is 80% efficient. Determine the effort needed to raise a car of mass 750kg.

Date posted: September 30, 2019. Answers (1)
- Sketch a graph of displacement against time for a body moving with uniform deceleration.(Solved)
Sketch a graph of displacement against time for a body moving with uniform deceleration.
Date posted: September 30, 2019. Answers (1)
- A car got a breakdown along a road inclined at an angle of 30o to the horizontal. The driver used a stone to stop the...(Solved)
A car got a breakdown along a road inclined at an angle of 30o to the horizontal. The driver used a stone to stop the car as he looked for a mechanic. However, a boy removed the stone and the car still moved down the road without the driver. State what provided the unbalanced force that made the car to accelerate downwards?
Date posted: September 30, 2019. Answers (1)
- Explain how the propellers on top of a helicopter help in lifting the helicopter above the ground.(Solved)
Explain how the propellers on top of a helicopter help in lifting the helicopter above the ground.
Date posted: September 30, 2019. Answers (1)
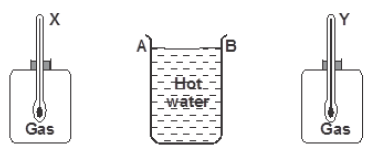
- The figure below shows a cylindrical container having hot water at 95oC. End A is shiny while end B is dull black. At equal distances...(Solved)
The figure below shows a cylindrical container having hot water at 95oC. End A is shiny while end B is dull black. At equal distances from the container is placed two identical gas jars fitted with thermometers X and Y. Compare the readings of the two thermometers after two minutes.
Date posted: September 30, 2019. Answers (1)
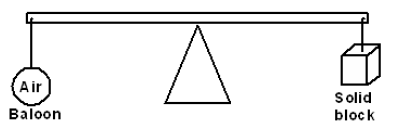
- The figure below shows an air balloon and a wooden block at equilibrium on a hot day.Explain how the equilibrium would be affected when the...(Solved)
The figure below shows an air balloon and a wooden block at equilibrium on a hot day.Explain how the equilibrium would be affected when the weather suddenly becomes cold.
Date posted: September 30, 2019. Answers (1)
- Figures 2a and 2b below shows a spring when carrying different masses.(Solved)
Figures 2a and 2b below shows a spring when carrying different masses.

i) the elastic constant of the spring.
ii) the length of the unloaded spring.
Date posted: September 30, 2019. Answers (1)
- The figure below shows a top view of two steel needles floating on water surface at a distance x metres apart.(Solved)
The figure below shows a top view of two steel needles floating on water surface at a distance x metres apart.
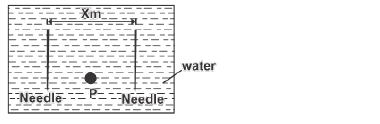
Very hot water is now poured at point P between the two needles. Explain any change in the distance x.
Date posted: September 30, 2019. Answers (1)