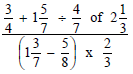
- Solve for x in the equation.
(Solved)
Solve for x in the equation.
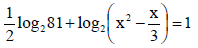
Date posted: November 5, 2019. Answers (1)
- The mass in kilograms of 9 sheep in a pen were 13, 8, 16, 17, 19, 20, 15, 14 and 11.
Determine the quartile deviation of...(Solved)
The mass in kilograms of 9 sheep in a pen were 13, 8, 16, 17, 19, 20, 15, 14 and 11.
Determine the quartile deviation of the data.
Date posted: November 5, 2019. Answers (1)
- Find the radius and centre of a circle whose equation is x2 + 4x + y2 – 8y + 11 = 0.(Solved)
Find the radius and centre of a circle whose equation is x2 + 4x + y2 – 8y + 11 = 0.
Date posted: November 5, 2019. Answers (1)
- State the amplitude and the phase angle of the curve (Solved)
State the amplitude and the phase angle of the curve 
Date posted: November 5, 2019. Answers (1)
- A DVD player whose cash price is sh. 15000 is bought on hire purchase by paying a deposit of sh 3000 and 12 monthly installments...(Solved)
A DVD player whose cash price is sh. 15000 is bought on hire purchase by paying a deposit of sh 3000 and 12 monthly installments of sh. 1250 each. Calculate the rate of interest per annum.
Date posted: November 5, 2019. Answers (1)
- a) Expand (1 -2x)4
b) Use the first four terms of your expansion to find the value of (0.99)4(Solved)
a) Expand (1 -2x)4
b) Use the first four terms of your expansion to find the value of (0.99)4
Date posted: November 5, 2019. Answers (1)
- The distance s metres of an object varies partly with time t seconds and partly with square root of time. Given that s = 16...(Solved)
The distance s metres of an object varies partly with time t seconds and partly with square root of time. Given that s = 16 when t = 4 and s = 48 when t = 16. Write an equation connecting s and t.
Date posted: November 5, 2019. Answers (1)
- Construct rectangle ABCD in which AB = 4cm and BC = 3cm. Inside the rectangle construct the locus of point L1 which is 3 cm...(Solved)
Construct rectangle ABCD in which AB = 4cm and BC = 3cm. Inside the rectangle construct the locus of point L1 which is 3 cm from A; Locus of L2 which is equidistant from line AB and AD and locus of point L3 which is 2cm from line AB.
Date posted: November 5, 2019. Answers (1)
- The dimensions of a rectangle are measured and given as 6.9 cm by 3.06 cm,
Calculate to 4 s.f. the percentage error in the area.(Solved)
The dimensions of a rectangle are measured and given as 6.9 cm by 3.06 cm,
Calculate to 4 s.f. the percentage error in the area.
Date posted: November 5, 2019. Answers (1)
- The equation of a curve is given as y = x3 – 3x + 2.
Determine
a) the value of y when x = 2
b) the...(Solved)
The equation of a curve is given as y = x3 – 3x + 2.
Determine
a) the value of y when x = 2
b) the gradient of the curve at x = 3.
c) the turning points of the curve and their nature.
Date posted: November 5, 2019. Answers (1)
- The table below gives some of the values of x and y for the function y = 1/2x2 + 2x + 1 in the interval...(Solved)
The table below gives some of the values of x and y for the function y = 1/2x2 + 2x + 1 in the interval 0 ≤ x ≤ 6

a) Use the values in the table to draw the graph of the function on the grid provided.
b) i) Using the graph and the mid-ordinate rule with six (6) strips, estimate the area bounded by the
curve, the x – axis, the y- axis and the line x = 6.
ii) If the exact area of the region described in (b) (i) is 78cm2; calculate the percentage error
made when the mid-ordinate rule is used.
Date posted: November 5, 2019. Answers (1)
- a) Given that the matrix find A-1, the inverse of A.
b) Kariuki bought 400 goats and 600 sheep for a total of Kshs 1.7m....(Solved)
a) Given that the matrix  find A-1, the inverse of A.
b) Kariuki bought 400 goats and 600 sheep for a total of Kshs 1.7m. Maina bought 180 goats and 240 sheep for a total of Kshs 720,000. If the price of a goat is sh. X and that of a sheep is shs y,
i) Form two equations to represent the above information.
ii) Use the matrix A-1 to find the price of one goat and one sheep.
c) John bought 450 goats and 720 sheep. He was given a total discount of shs 66,600.
Date posted: November 5, 2019. Answers (1)
- In the figure below OA = a, OB = b, OA : AE = 2 : 3 and OB : OC = 1 : 2
a)...(Solved)
In the figure below OA = a, OB = b, OA : AE = 2 : 3 and OB : OC = 1 : 2
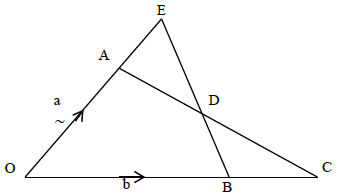
a) Express AC and BE in terms of a and b
i) AC
ii) BE
b) If DC = kAC and BD = mBE where k and m are scalars.
By expressing DC in two ways, determine the values of k and m.
c) Find the ratio of BD : DE
Date posted: November 5, 2019. Answers (1)
- A house is to be sold either on a cash basis or through a loan. The cash price is Kshs. 750,000. The loan conditions are...(Solved)
A house is to be sold either on a cash basis or through a loan. The cash price is Kshs. 750,000. The loan conditions are as follows: there is to be a down payment of 10% of the cash price and the rest of the money to be paid through a loan of 10% per annum compound interest.
A customer decided to buy the house through a loan.
a) i) Calculate the amount of money loaned to the customer.
ii) The customer paid the loan in 3 years.
Calculate the total amount paid for the house.
b) Find how long the customer would have taken to fully pay for the house if she paid a total of Kshs 891,750.
Date posted: November 5, 2019. Answers (1)
- A cylindrical water tank is of diameter 7 metres and height 2.8 metres.
a) Find the capacity of the water tank in litres.
b) Six members...(Solved)
A cylindrical water tank is of diameter 7 metres and height 2.8 metres.
a) Find the capacity of the water tank in litres.
b) Six members of a family use 15 litres each per day. Each day 80 litres are used for cooking and washing and a further 60 litres are wasted.
Find the number of complete days a full tank of water would last the family.
c) members of the family were absent for 90 days. During the 90 days, wastage was reduced by 20% but cooking and washing remained the same. Calculate the number of days a full tank would now last the family.
Date posted: November 5, 2019. Answers (1)
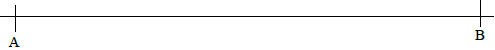
- Divide line AB such that AP = 2/5 AB(Solved)
Divide line AB such that AP = 2/5 AB
Date posted: November 5, 2019. Answers (1)
- Use the matrix method to find the co-ordinates of the points of intersection of the line
3x - 4y = 1 and y + 7x =...(Solved)
Use the matrix method to find the co-ordinates of the points of intersection of the line
3x - 4y = 1 and y + 7x = 23
Date posted: November 5, 2019. Answers (1)
- In the figure below the lines AB and CD are parallel. AD and CB intersect at X. AB = 6cm, CD = 9cm and DX...(Solved)
In the figure below the lines AB and CD are parallel. AD and CB intersect at X. AB = 6cm, CD = 9cm and DX = 3 cm.
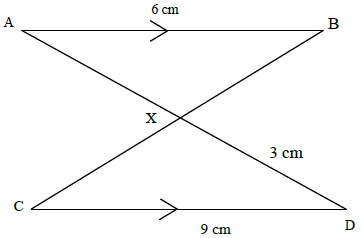
a) Calculate the length of AX.
b) The area of ΔABX is 6cm2. Calculate the area of ΔCXD.
Date posted: November 5, 2019. Answers (1)
- Without using a calculator evaluate(Solved)
Without using a calculator evaluate
Date posted: November 5, 2019. Answers (1)
- A line L is perpendicular to the line Given that L passes through (3, 10).
Find the
a) Gradient of L
b) Equation of L in...(Solved)
A line L is perpendicular to the line  Given that L passes through (3, 10).
Find the
a) Gradient of L
b) Equation of L in form of y = mx + c where m and c are constants.
Date posted: November 5, 2019. Answers (1)