- Solve the quadratic equation by completing the square method. 2x2 - 5x = -3(Solved)
Solve the quadratic equation by completing the square method.
2x2 - 5x = -3
Date posted: November 8, 2019. Answers (1)
- In the figure below, AB is a diameter of the circle. Chord PQ intersects AB at N. A tangent to the
circle at B and meets...(Solved)
In the figure below, AB is a diameter of the circle. Chord PQ intersects AB at N. A tangent to the
circle at B and meets PQ produced at R.

Given that PN = 14 cm, NB = 4 cm and BR = 7.5 cm, calculate the length of;
a) NR
b) AN
Date posted: November 8, 2019. Answers (1)
- Calculate the exact value of compound interest earned on Sh. 20 000 for 1 and half years at the rate of 12% p.a, compounded half yearly.(Solved)
Calculate the exact value of compound interest earned on Sh. 20 000 for 1 and half years at the rate of 12% p.a, compounded half yearly.
Date posted: November 8, 2019. Answers (1)
- Given that z varies directly as the square of x and inversely as the square root of y.(Solved)
Given that z varies directly as the square of x and inversely as the square root of y. If x = 2, y = 9
when z = 3, find z when x = 3 and y = 4.
Date posted: November 8, 2019. Answers (1)
- Solve for x in the equation log (5x - 15) - log(2x - 3) = 1(Solved)
Solve for x in the equation
log (5x - 15) - log(2x - 3) = 1
Date posted: November 8, 2019. Answers (1)
- The equation of a curve is given by y=x3 + 4x2 - 3x.(Solved)
The equation of a curve is given by y=x3 + 4x2 - 3x.
a) Find the value of y when x=1
b) Determine the stationary points of the curve.
c) Find the equation of the normal to the curve at =1 .
Date posted: November 8, 2019. Answers (1)
- (a) The ratio of Juma’s and Akinyi’s earnings was 5:3. Juma’s earnings rose to Ksh 8 400 after an increase of 12%. Calculate the percentage...(Solved)
(a) The ratio of Juma’s and Akinyi’s earnings was 5:3. Juma’s earnings rose to Ksh 8 400 after an increase of 12%. Calculate the percentage increase in Akinyi’s earnings given that the sum of their earnings was Ksh. 14 100.
(b) Juma and Akinyi contributed all the new earnings to buy maize at Ksh 1 175 per bag. The maize was then sold at ksh 1 762.50 per bag. The two shared all the money from the sales of the maize in the ratio of their contributions. Calculate the amount that Akinyi got.
Date posted: November 8, 2019. Answers (1)
- The figure below represent two neighboring plots with QR as their common boundary.
Find to 2 decimal places,
i. The length of boundary PQ.
ii. The length of...(Solved)
The figure below represent two neighboring plots with QR as their common boundary.
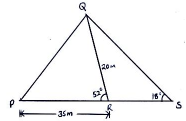
Find to 2 decimal places,
i. The length of boundary PQ.
ii. The length of boundary RS.
iii. The angle RQS.
iv. Area of triangle QRS.
Date posted: November 8, 2019. Answers (1)
- On the grid provided, draw the square whose vertices are A(6, -2), B(7, -2), C(7, -1) and D(6, -1).(Solved)
On the grid provided, draw the square whose vertices are A(6, -2), B(7, -2), C(7, -1) and D(6, -1).
On the same grid, draw:
(i) A’B’C’D’ the image of ABCD, under an enlargement scale factor 3 centre (9, -4)
(ii) A"B”C”D” the image of A’B’C’D’ under a reflection in the line x = 0
(iii) A”’B’”C’”D’” the image of A”B”C”D” under a rotation of +90° about (0,0).
Date posted: November 8, 2019. Answers (1)
- Complete the table below for the function y = 3x2 - 2x + 5(Solved)
a. Complete the table below for the function y = 3x2 - 2x + 5

b. Use the completed table and mid ordinate rule to estimate the area bounded by the curve, the x - axis
and the lines x = -3 and x = 5
c. Use calculus to calculate the actual area in part b above.
d. Calculate to 3 significant figure the percentage error when mid ordinate rule is used to estimate the
area.
Date posted: November 8, 2019. Answers (1)
- A line L1 passes through the points (-2, 3) and (-1, 6) and is perpendicular to L2 at (-1, 6).(Solved)
A line L1 passes through the points (-2, 3) and (-1, 6) and is perpendicular to L2 at (-1, 6).
a) Find the equation of L1.
b) Find the equation of L2 in the form ax + by - c = 0 where a, b and c are constants.
c) Given that another line L3 is parallel to L1 and passes through point (1,2) , find the x and y intercepts of L3 .
d) Find the point of intersection of L2 and L3.
Date posted: November 8, 2019. Answers (1)
- The diagram represents a solid frustum with base radius 21cm and top radius 14cm. The frustum is
22.5cm high and is made of a metal whose...(Solved)
The diagram represents a solid frustum with base radius 21cm and top radius 14cm. The frustum is
22.5cm high and is made of a metal whose density is 3 𝑔⁄𝑐𝑚3. (Take 𝜋 = 22/7)
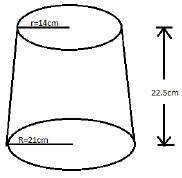
a) Calculate
(i) The volume of the metal in the frustum.
(ii) The mass of the frustum in kg.
b) The frustum is melted down and recast into a solid cube. In the process 20% of the metal is lost.
Calculate to 2 decimal places the length of each side of the cube.
Date posted: November 8, 2019. Answers (1)
- A number m is such that if its reciprocal is added to three times itself the result is 4. Form an equation in m and...(Solved)
A number m is such that if its reciprocal is added to three times itself the result is 4. Form an equation in m and solve it.
Date posted: November 8, 2019. Answers (1)
- At the end of his stay in Kenya, a French tourist had 3 420 French francs which he decided to change
into Euros. Given the exchange...(Solved)
At the end of his stay in Kenya, a French tourist had 3 420 French francs which he decided to change
into Euros. Given the exchange rate was;
1 French franc = Ksh. 11.25
1 Euro = Ksh. 72.50
Calculate the number of Euros he received if the bank charged him 2% commission.
Date posted: November 8, 2019. Answers (1)
- Expand and simplify (1 - 4x)6 up to the expansion of the term in x3.(Solved)
Expand and simplify (1 - 4x)6 up to the expansion of the term in x3.
Date posted: November 8, 2019. Answers (1)
- Solve the equations below using matrix method.
x + y = 8
2y - 3x = 1(Solved)
Solve the equations below using matrix method.
𝑥 + 𝑦 = 8
2𝑦 − 3𝑥 = 1
Date posted: November 8, 2019. Answers (1)
- Find the area of the shaded region in the figure below given that AD = 15 cm, BE = 3 cm, AB = 3 cm,
???????...(Solved)
Find the area of the shaded region in the figure below given that AD = 15 cm, BE = 3 cm, AB = 3 cm,
∠𝐷𝐴𝐵 = ∠𝐸𝐵𝐶 = 90°.

Date posted: November 8, 2019. Answers (1)
- A man sets off by bus on a journey of 130 km. after the bus has traveled 119 km at an average speed of 42...(Solved)
A man sets off by bus on a journey of 130 km. after the bus has traveled 119 km at an average speed of 42 𝑘𝑚/ℎ𝑟, it breaks down and he is immediately given a lift by a passing cyclist who takes him to his destination at average speed of 66 km/h.
Calculate;
a) The time taken for the whole journey.
b) His average speed for the whole journey.
Date posted: November 8, 2019. Answers (1)
- The position vectors of A and B are respectively. Find the magnitude of the vector AB.(Solved)
The position vectors of A and B are  respectively. Find the magnitude of the vector AB.
Date posted: November 8, 2019. Answers (1)
- (a) Using a ruler and a compass only, construct triangle ABC in which BC = 8 cm,
angle ABC = 30° and angle ACB = 45°...(Solved)
(a) Using a ruler and a compass only, construct triangle ABC in which BC = 8 cm,
angle ABC = 30° and angle ACB = 45° .
(b) At A drop a perpendicular to meet BC at D and measure AD.
Date posted: November 8, 2019. Answers (1)