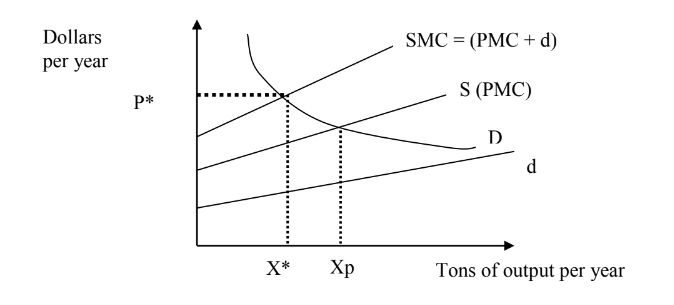
In a free market where the optimality rules have been followed the quantity produced will
occur at quantity Xp and price Pm, the point where demand (D) equals the private marginal
cost (PMC). However where a negative externality exists the market fails to produce the
socially optimal level of production. This is because the marginal damage (d), generated by
the negative externality, is a cost not taken in to account in the market. When a social
marginal cost (SMC) curve is generated it is possible to see that socially optimal level of
production is in fat X* and that the product should be sold at a higher price P* to reflect the fact that the true social cost of the product is higher than the private cost.
NatalieR answered the question on
June 21, 2022 at 08:19