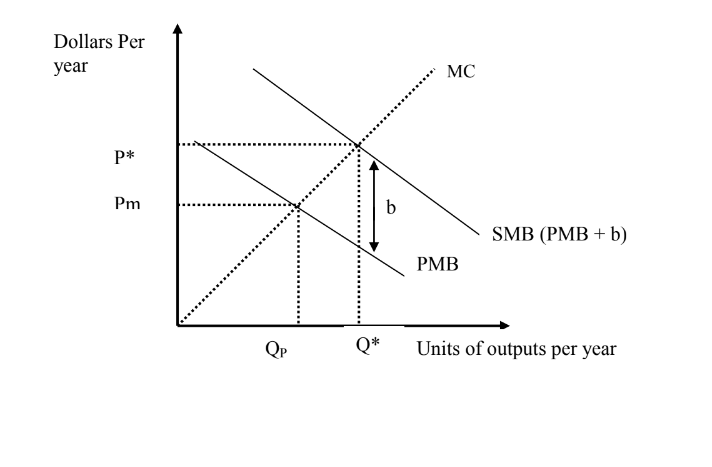
The figure above illustrates the implications for the optimality rules of a positive externality. The market equilibrium in this situation occurs at quantity' Q* and price
Pm where the private marginal benefit (PMB) of the item equals its marginal cost. However
this item produces an external benefit (b) which is not taken in to account by the market. The socially optimal quantity of this item actually occurs where the social marginal benefit
(SMB) curve derived by summing the private marginal benefit and the external benefit,
equals the marginal cost of producing the item. This analysis suggests that the allocation
efficient situation occurs at quantity Q* and price p*.
Effect of positive externalityThe conclusion which can be drawn from this is that true allocation efficiency will not be
achieved unless the external benefits and costs associated with externalities are taken in to account when making economic analysis.
NatalieR answered the question on
June 21, 2022 at 08:32